The 300 Dimensions Sphere Model
Hallo, Friends!!
I wrote here an Evolution Strategy, (mu+lambda)-ES, to solve the function called "The Sphere Model". Well, this function is not so difficult to solve and is often applied to verify the convergence rate of some Evolutionary Algorithms, like Evolution Strategies.
The Sphere Model is as follow:
F = sum(x(i)^2)
i = 1:n
As you can see the function is not so complicated, but this does not shrink its merit inside the Evolutionary Computation World and, as I said before, that function is very useful to analyse some properties of the Evolutionary Algorithms.
The Sphere Model Configurations:
Kind of Problem: Minimization
Number of Dimensions(n or variables): 300
Variables' Search Space: x(i) = [-100:100], i = 1:300
Global Optimum: F = 0.0
Optima Variables: x(i) = 0.0, i = 1:300
Below you can see a two dimensional Sphere Model:

Another view:

To solve the 300 dimensions Sphere Model I used an Evolution Strategy, its configuration is:
Number of Parents(mu): 15
Number of Offspring(lambda): 35
Number of Generations: 100,000
Mutation: Yes
Crossover: Yes
Selection: Plus - (mu + lambda)-ES
Best Initial Fitness: 920084.13354163163
Best Final Fitness(after 100,000 generations): 1.5747132969144893e-127
Simulation Time: 12,243 s
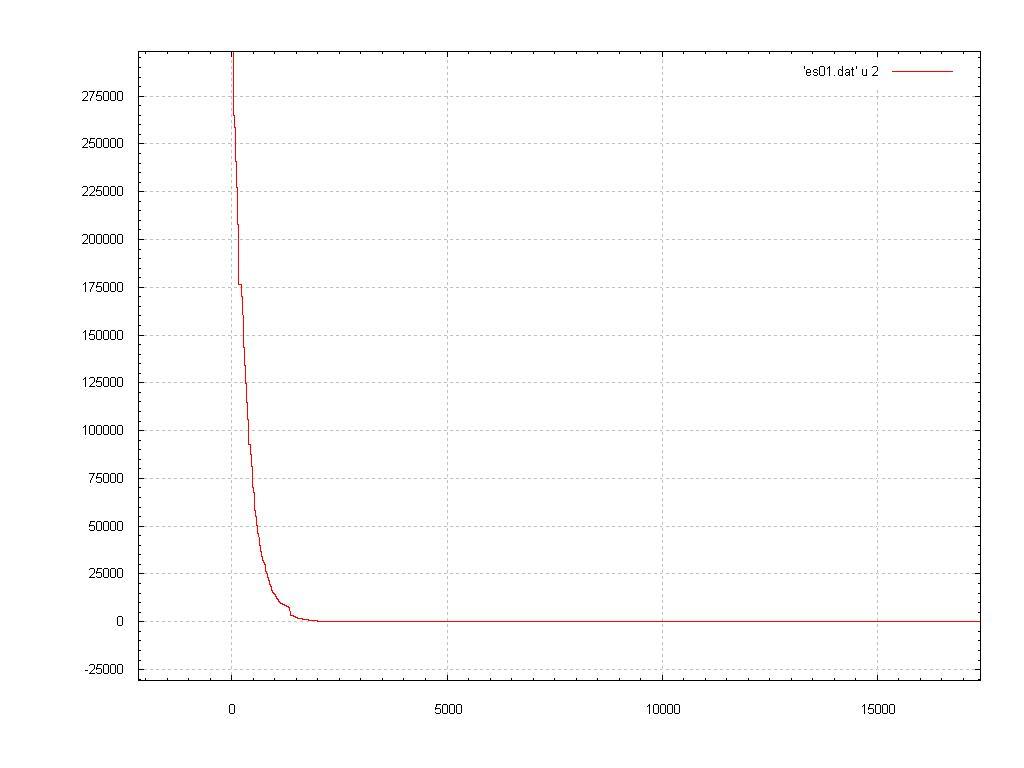
Below you can see a chart that show you the progress of the best fitness versus the number of generations.

You can note that the Evolution Strategy goes close to the optimum very "fast" and the major part of the time is spent on fine tunning the best solution(s).
Another chart:

Well, I do not know the value of each of the 300 variables (because I did not take them), but I can guarantee you that all 300 variables were very close to the optimum, a prove for this is the value of the best final fitness: 1.5747132969144893e-127
Até Mais!! (Until Later!!)
Nosophorus
I wrote here an Evolution Strategy, (mu+lambda)-ES, to solve the function called "The Sphere Model". Well, this function is not so difficult to solve and is often applied to verify the convergence rate of some Evolutionary Algorithms, like Evolution Strategies.
The Sphere Model is as follow:
F = sum(x(i)^2)
i = 1:n
As you can see the function is not so complicated, but this does not shrink its merit inside the Evolutionary Computation World and, as I said before, that function is very useful to analyse some properties of the Evolutionary Algorithms.
The Sphere Model Configurations:
Kind of Problem: Minimization
Number of Dimensions(n or variables): 300
Variables' Search Space: x(i) = [-100:100], i = 1:300
Global Optimum: F = 0.0
Optima Variables: x(i) = 0.0, i = 1:300
Below you can see a two dimensional Sphere Model:

Another view:

To solve the 300 dimensions Sphere Model I used an Evolution Strategy, its configuration is:
Number of Parents(mu): 15
Number of Offspring(lambda): 35
Number of Generations: 100,000
Mutation: Yes
Crossover: Yes
Selection: Plus - (mu + lambda)-ES
Best Initial Fitness: 920084.13354163163
Best Final Fitness(after 100,000 generations): 1.5747132969144893e-127
Simulation Time: 12,243 s
Below you can see a chart that show you the progress of the best fitness versus the number of generations.

You can note that the Evolution Strategy goes close to the optimum very "fast" and the major part of the time is spent on fine tunning the best solution(s).
Another chart:
Well, I do not know the value of each of the 300 variables (because I did not take them), but I can guarantee you that all 300 variables were very close to the optimum, a prove for this is the value of the best final fitness: 1.5747132969144893e-127
Até Mais!! (Until Later!!)
Nosophorus
posted by Marcelo at 6:35 PM
![]()


4 Comments:
Hi!!
I am working on a optimization algorithm called "Particle Swarm Optimization". I see that the algorithm for schaffer function gets stuck at a particlualr value near zero.
Can you please contact me..would like to ask for few details.
You can find the technical report of my work "Do not be afraid of Local Minima: Affine Shaker and Particle Swarm"
My contact ID: srinivas@dit.unitn.it
Thanks,
Srinivas
Hi again!!
Can you give some information on how did you generate the plots of the sphere model.
Is it gnuplot or did you use anything else..
Thanks,
Srinivas
HI, Srinivas!!
I sent you an e-mail with some informations, but, if those are not enough to ease your questions, please, feel free to ask anything about Evolutionary Algorithms and gnuplot.
Até Mais!! (Until Later!!)
Marcelo
Hi,
for plotting function value versus time I would recommend to use a log scale for the y-axis...it's quite useful in particular on the sphere model.
Cheers,
Niko
Post a Comment
<< Home